Green Shoots or a Death Rattle? Commercial Archaeology in Northern Ireland in 2015
Introduction
It’s that time of year
again … the evenings are dark and cold … we’ve put up the tree and are
listening to carols … you’re writing Christmas cards … and Chapple is poring
over financial statements for several archaeological consultancies … it’s
tradition!
Since 2014 I’ve tried
to keep tabs on how the commercial archaeological sector in Northern Ireland is
faring financially [here
| here
| here].
Initially, the data went from 2007/2008 to 2013 and was presented as a series
of static tables and graphs created in MS Excel. As I have added in the latest
data when it became available, I have also endeavoured to push back the start
date, to provide the most complete portrait possible. Now the data goes back to
1998 for one company and their earliest sets of accounts for each of the other
three consultancies operating in Northern Ireland. I have also moved away from
the static graphs to a dynamic, interactive visualisation of the data, created
in Tableau Public [here
and at the bottom of this post].
What’s new?
The original legal
advice I was given was that, for the purposes of transparency and
accountability, I should be open and positively identify which company is
which. I, for a number of reasons, shied away from this direct approach and
elected instead to identify each company only by its year of incorporation.
Anyone wishing to go deeper into the data would have to go to a separate
appendix and make the connections manually. However, for this new edition, I
have been persuaded that such an obfuscation is neither necessary nor
desirable. A number of people have put it to me that it is unnecessary as
everyone clearly knows which company is which and continually referring to them
by code is simply annoying.
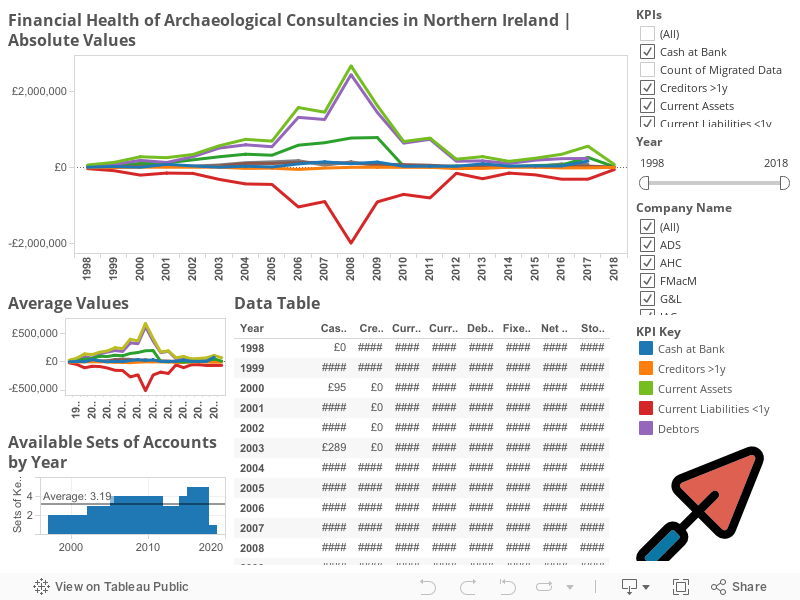
 |
| Screenshot of the current state of the Tableau visualisation. Data shown ranges from 1998-2015 |
Archaeological Development Services (ADS)[The 1990 Co]
Archaeology
Development Services have not submitted any end of year accounts since
2011. Their Facebook
page has not been updated since June 2014. The CompanyCheck
website currently [Dec 2016] lists them as ‘In Liquidation’. The UKCorporateList website
gives the status as ‘Voluntary Agreement’. The UK Government website describes
a Voluntary
Agreement as one where a company is insolvent but an agreement is reached
with creditors to allow them to remain trading while they attempt to pay their
debts. The checkbusiness
website gives their status as ‘Winding Up Order’. All these websites appear
to deal with the portion of the business operating in the United Kingdom.
However, the SoloCheck.ie website (reporting on the company operating in the
Republic of Ireland) gives their Current Status as ‘Normal’. Nonetheless, their
adsireland.ie website (listed on Facebook and LinkedIn)
cannot be reached. Earlier attempts to call them have received no answers.
Taken together, it seems that they have gone out of business … no detective
awards coming my way for that! However, I have not been able to ascertain the
ultimate fate of the contents of their storage and processing facility in
Kells, Co. Meath. Eoin Halpin, one of the company directors, gave an interview
to the BBC in 2014 that talked about the “Hundreds of
thousands of archaeological items recovered from historic sites in Northern
Ireland are lying unclassified in plastic bags and boxes”. If the company
has closed for good, what has become of all these artefacts, ecofacts, and site
archives? Unfortunately, my earlier attempts to gain answers from the NIEA may,
at best, be described as ‘unhelpful’. For the purposes of this post, I have
removed all ADS data from the discussion, concentrating solely on the financial
histories of those three companies still active.
 |
| Archaeology Development Services. All Financial KPIs, 1998-2011 |
The Overall Picture
If we sum up all the
financial activity of the tree remaining companies, we see that 2015 was a
mixed year, with relatively little to celebrate. The three companies had all of
£22,638 (Av.: £9,213) cash at bank. This is down from £29,238 (Av.: £9,746) the
previous year and is small beer in comparison to the high of £140,071 in 2007
(Av.: £46,690). Current Assets are up to £230,593 (Av.: £76,864) from £154,395 (Av.:
£51,465) the previous year. Again, this is a small-scale recovery (itself down
from the 2013 figures) and nothing in comparison to the 2008 high of £769,124
(Av.: £256,375). However, it must be kept in mind that substantial portions of
these Current Assets are made up of the amount owed to these companies by their
Debtors. While it is undoubtedly great to be owed money, this form of wealth is
somewhat less than stable and secure. While the percentages vary between the
three companies (from c.70-93%), it
is in all cases a substantial proportion of their Current Assets, and there is
little here to bring comfort. At the end of 2015 the combined debtors for the
three companies came in at £184,984 (Av.: £61,661). This is markedly up from
the previous year’s total of £98,657 (Av.: £32,886), but once again
significantly below historic highs of £551,062 in 2007 and £545,761 in 2008.
While an increase in the amount owed to the companies by their Debtors is indicative
of more work being completed, it is also of concern as it represents monies as
yet unpaid. On the positive side, the accounts indicate that none of the
companies owe longer-term Creditors (> 1 yr), recovering from historic debts
of £36,788 (Av.: £12,263) in 2012. However, the total Current Liabilities
(coming due within one year) owed by the companies at the end of 2015 was
£196,274 (Av.: £65,425), an increase from £154,750 (Av.: £51,583) the previous
year. This still represents an extraordinary recovery from the historic high of
£303,985 (Av.: £101,328) in 2013. Total fixed Assets for the companies was
valued at £9,580 (Av.: £3,193) at the end of 2015 and represents an overall
depreciation in assets with little evidence for investment from the historic
highs of £59,481 (Av.: £19,827) in 2007. The combined value of Stock/Other
assets is given as £17,971 (Av.: £5,990). Once again, this is markedly down in
the previous year’s total of £26,500 (Av,: £8,833), but above this century’s
historic low of £7,000 (2011) and insignificant in comparison to the all-time
high of £140,190 (£46,730) recorded in 2008. The bottom line is, of course, the
combined Net Worth that gives an indication of the value of the sector as a
whole. At the end of 2015 the total was £43,899 (Av.: 14,633) up from the
previous year (£10,296) and well above the historic low of -£14,976 returned in
2013. Ostensibly, the figure shows a sector in recovery, though well below
historic high of £537,276 (Av.: £179,092) recorded in 2008. If the 2015 figures
do represent the first green shoots of recovery, it must be regarded as one
that is fragile and uncertain. It in no way shows an industry performing at
anything like its past peaks. It would be wrong to completely dismiss this as a
hopeful sign, but it would be equally wrong to over hype it as solid evidence
of real growth in the sector. Only time (and more data) will tell.
While the combined and
average figures go some way to describing the commercial archaeology sector as
a whole, it is still worthwhile delving deeper into the data to see how each of
the surviving companies have fared.
Gahan and Long (G&L)[The 2002 Co]
Gahan
and Long are run by Chris Long and Audrey Mary Louise Gahan. While 2015 was
by no means spectacular, they survived and appear to have kept their heads
above water. Their Cash at Bank was given as £6,217, up from £3,663 the year
before, and £2,382 in 2013, but far below their historic high of £82,045 in
2006. There is a broadly similar story with their Current Assets, up
year-on-year from £27,269 in 2013 to £87,693 in 2015, but much reduced from the
£381,303 recorded in 2007. However, the period from 2013 to 2015 shows a
remarkably close correlation between Current Assets and the monies owed to the
company by Debtors. In 2013 Debtors owed £24,887, making up 91.26% of the
Current Assets. By 2015 the figure owed by Debtors had risen to £81,422 and
accounted for 92.85% of the Current Assets. To reiterate – it’s great to have
won contracts and gotten jobs, but it’s less good when you’re still waiting to
be paid for them. The value of Fixed Assets is given as £6,091 in 2015 and
represents the latest in a long decline from a high of £37,008 in 2007. While
Fixed Assets depreciate over time, it would appear that there has been no
strong investment back into the company. While the value of Current Liabilities
(payable within one year) had been declining from 2011 (£111,569) to 2014 (£85,870),
they have taken a slight dive to £92,849 in 2015. While somewhat concerning, it
is still much better than the debt of £144,995 recorded in 2008. From the
accounts submitted, it would appear that the company has no outstanding
Creditors to be paid back in more than one year, nor do they have any Stock or
other assets. Gahan and Long only record a 2015 Net Worth of £935, but this is
a marked improvement on the negative returns for 2013 (-£70,144) and 2014
(-£41,423). While there must be a temptation to celebrate this return to a
positive net worth, the fact remains that this result is dizzyingly far below
the ‘boom’ years of, say, 2007 (£280,440) and even 2009 (£257,938). My analysis
would be that, while there is some evidence for a return to profitability, it
is small and (in comparison to their best years) insignificant.
 |
| Gahan and Long. All Financial KPIs, 2003-2015 |
FarrimondMacManus (FMacM)[The 2005 Co]
Christopher John
Farrimond and Ciara Mary MacManus are the people behind FarrimondMacManus.
All things considered, they didn’t have a bad year. Their Cash at Bank was
£18,738. True, this figure is a significant decrease on the 2014 result (£24,041),
and well below the £85,858 of 2013. Nonetheless, it is still the highest of any
of the three companies in the sector for 2015. Current Assets are up to £74,439
from £37,421 in 2014. This is, of course, mirrored in the Debtors data, where
the figure rose from £13,380 in 2014 to £55,701. However, in 2014 Debtors comprised
c.36% of the Current Assets, and this
has – rather worryingly – risen to c.75%.
For 2014 and 2015 Fixed Assets have been valued at £0 – a long way down from
the historic peak of £11,720 in 2010. At the very simplest level, this would
suggest that there has been little in the way of investment into the company.
On the other hand, Creditors falling due in more than one year have remained
constant at £0 since 2013. Even when such did exist (2008 & 2010) they were
very modest, in the order of £3,400. At the same time, Current Liabilities (payable
in less than one year) have increased markedly to £34,995 from £7,750 in 2014. Again,
this is much better than the 2013 figure of £90,585. Stock or other assets are
listed at £0, and have been since 2011. Taken together, the Net Worth of FMacM
is listed as £39,444. Although far below the £90,548 of 2008, or even the
£61,611 of 2013, this is still a good result, making FarrimondMacManus (by far)
the most valuable company in the sector.
 |
| FarrimondMacManus. All Financial KPIs, 2006-2015 |
Northern Archaeological Consultancy (NAC)[The 1997 Co]
Finally, we come to Northern
Archaeological Consultancy whose directors are listed as Alan Reilly,
Stephen William Gilmore, and Colin David Dunlop. At the end of 2015 NAC had all
of £2,629 Cash at Bank. This was a marginal improvement on the £1,534 of 2014,
and especially the £325 of 2013, but far below the heady results of £49,531
recorded in 2007. Their Current Assets are £68,461, down from £78,525 the previous
year and the £99,059 of 2013. Once again, these figures are all quite
insignificant in comparison to the historic high of £308,049 from 2007. Again,
the story of the Current Assets is tied to the company’s Debtors. In 2015
Debtors were valued at £47,861 and made up 69.91% of Current Assets. The value
of the Debtors has been falling from £74,747 in 2013 (75.46%) to £50,491 in
2014 (64.30%). It is easy to suggest that a fall in the amount owed by clients
is a good thing, indicating that the company has been successful in collecting
debts. However, it may also be taken as a broad indicator of the volume of work
undertaken by the company, and a three-year decline (paralleling the 2008-2012
economic downturn) can only be regarded with concern. Fixed Assets are listed
at £3,489. This is down slightly from £4,653 the previous year and markedly so from
2007’s £20,923. This would suggest that the slight investment noted in 2014 has
not been sustained and that it was but a blip in a larger, downward progression
of non-investment since the beginning of the economic downturn in 2008. On the
positive side, NAC list their Creditors requiring repayment more than one year
in the future at £0 (the same as 2014). This is a major recovery from historic levels
of debt in the region of £31-35,000 recorded in 2012 and 2013. The company’s
history of Current Liabilities is rather more turbulent. At the end of 2015 these
were valued at £68,430, an increase from £61,130 the previous year. All this is
rather small beer in comparison to 2006’s £137,754, but the general trend since
1998 has been towards increasing levels of Current Liabilities. The value of
Stock or other assets is given as £17,971. The period from 2012 to 2014 had
seen this figure remain relatively stable, in the range from £24-29,000, and
this represents a noticeable dip. Once again, these appear as minor
fluctuations in comparison to historic highs of £132,010 recorded in 2008 and
even £107,202 in 2006. Obviously, these variable results have a direct impact
on the current Net Worth of the company. At the end of 2015 NAC’s Net Worth was
listed as £3,520 – a massive and worrying drop from £22,048 the previous year.
Indeed, the period from 2010 has been exceptionally unstable for the company,
with Net Worth fluctuating between positive and negative valuations. These have
ranged from 2014’s £22,048 down to -£23,735 in 2011. While the trend over this
period has been (broadly) going upwards, the degree of volatility can bring
little comfort or hope for security. In any case, these results are far below
historically high Net Worth valuations of £200,667 in 2007 or even £187,796 in
2008.
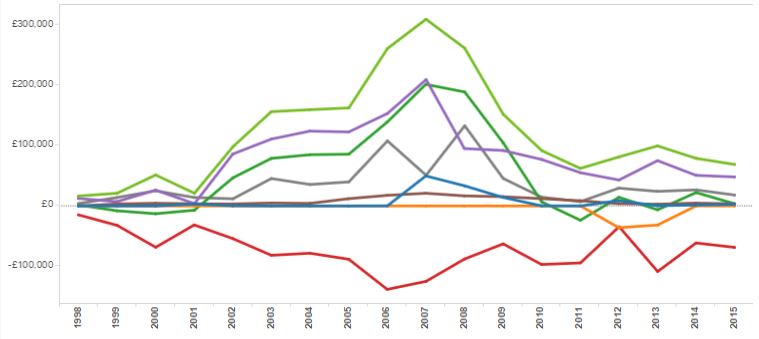 |
| Northern Archaeological Consultancy. All Financial KPIs, 1998-2015 |
Conclusions
While the overall picture
is ever so slightly hopeful for the commercial archaeology sector in Northern
Ireland, the individual companies are not contributing equally to that image.
The underlying point of this exercise is – as always – to ask how safe and
secure are the artefacts and archives these companies hold. This is the
physical evidence of our ancient past, part of our shared cultural identity,
and the deep history of this land. If one of these went out of business the
possible losses to our shared heritage could be catastrophic. We have already
seen ADS apparently wind up its operations in Northern Ireland (though their
status in the Republic of Ireland appears to be different) with no apparent
intervention from the Northern Ireland Environment Agency to protect or rescue
material from this jurisdiction. At this time, I have no knowledge of the fate
of these items, though I can only imagine that it must be rather perilous if
there is no active company involved in their curation. Despite modest (though
variable) profitability in the remaining consultancies, their fates and
finances of none are secure, and it is likely that at least one could have
ceased trading within the medium term. Should this happen, there is absolutely
no guarantee that the loss of jobs involved will not be mirrored by a loss of
our shared cultural heritage. Once again, we can but wait to see what the 2016
accounts bring … are we witnessing the green shoots or recovery or the death
rattle of an entire sector?
This is my analysis. It
is based on the available figures submitted by these companies in their end of
year statements of accounts. However, there may be more in the data that has
not registered with me. Please feel free to use the Tableau dashboard below to examine the data in ways meaningful to you and make your own discoveries.


Comments
Post a Comment