The global spread of the Printing Press | A collection of points representing an enthusiasm for data
Some years ago I spotted a lovely image on one of my trawls through the internet. While I do enjoy a breathtaking landscape or a beautifully captured scene - preferably with archaeology involved - this was something special. It was a simple set of six maps of Europe showing the 'Cities with Printing' at decade intervals from 1450 to 1500. It clearly showed an explosion from the single dot representing Johannes Gutenberg and his Bible in Mainz around 1452 to incorporate cities across the continent, from Portugal to Poland and from the toe of Italy to southern England by the turn of the sixteenth-century. A bit of searching led me to Nicholas Carr's Rough Type blog, and thence to Jeremiah Dittmar's 2011 paper Information Technology and Economic Change: The Impact of the Printing Press. It's well worth a read as he manages to quantify the rate and magnitude of city growth where early printing presses were established over those who were left behind in the advancing technological wave. Although it's an excellent paper, my fascination with his block of six maps lingered longer. I thought it might be interesting to combine them as an animated GIF or seek some other means of visualising the data. As you can see below, my quick experiment using a free online GIF maker was fun, but not without flaws. There had to be a better, more interesting way to approach this.
 |
| Cities with Printing 1450-1500 (Source) |
 |
| Animated GIF based on the above |
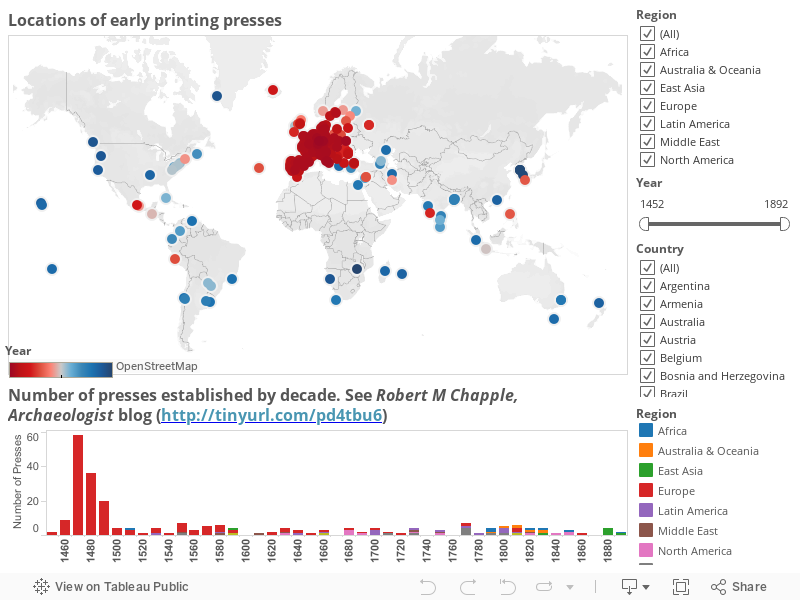
After this, I largely forgot about the problem. I mentally filed it away for later thought and action, but as is the way of such things, I occasionally thought about it, but there was little actual work. That was the situation until a little after my last birthday. One day a package arrived in the post. It was sent from Lexington, Kentucky, on behalf of my brother and it included a treasure trove of audio delight ... a selection of signed discs by the genre-defying musical genius that goes by the name of Wooden Wand. One of the discs was Horus of the Horizon that contained the beautifully Byzantine, rambling, evocative track War Star Days. One line in this song ('When we failed to hijack the printing press, it wasn't for lack of nerves or skill') suddenly brought the other printing press question to my mind. Since before Christmas, I'd been trying to teach myself about Tableau, a suite of 'interactive data visualization products focused on business intelligence'. At the time, this was purely driven from the perspective of my other life in IT - I'd not really thought about applying the tools to archaeological or historical questions. In a moment - before the song had even finished - I had formulated a plan to apply one to the other and see the results. The first issue was to get the baseline data - a list of cities and years of establishment. Dittmar, rather unhelpfully, does not supply this in an easy list (dude! ... what were you thinking?), but I have been able to get quite a volume of data from the Wikipedia article ‘Global spread of the printing press’. After that it was a case of making the data 'presentable' and getting geolocations for each point. I'm not going to detail all that here, but for anyone wanting to know more about the process, I make an attempt to clarify my process below. I will say that I was so taken with the results and the relative ease by which they could be plotted and displayed, I abandoned my initial plan just to tackle the European evidence and went for all the global data I could get. Anway, what you see here is the result of that work - the whole runs off an MSExcel spreadsheet with 240 lines of data - one for each printing press. This contains summary details on the establishment of printing presses in 227 cities, in 68 countries, in the period from 1452 to 1892. For ease of analysis, these are further sub-divided into nine regions. The lower portion of the dashboard is a histogram - divided in 10 year bins - showing the numbers of presses established. So far, so traditional: you've got a distribution map and a bar chart! Rejoice! But this is where Tableau is different ... based on your choices, you can play around dynamically interact with the data and create personalised drill-downs. Using the check boxes on the right-hand edge, if you only want to see only the European examples ... you got it! ... or just the Middle East and North America ... done! Within that you can add and delete country data to your heart's content! You can show all of the Latin American Data, but drop off Mexico and Cuba ... if that took your fancy. The coloured scale (floating above the map) changes intensity to mirror the data being displayed ... but the histogram dynamically reacts to only show you the data directly relevant to the map search - that includes trimming off unnecessary bins on either end to improve the vizualisation. The double-ended slider is set to its extremes (1452-1892), but shows a narrow dark bar inside it, if the data you've selected is between these extremes. If you want to exclude some data based on it being too early or too late for your tastes, you can do that too ... and in all cases the histogram below changes to mirror the mapped data you've selected. It's fairly intuitive, so just go explore & dynamically interact with the data and create personalised drill-downs play around with it.
[Sorry! The viz was going to go in here, but it was conflicting with all the stuff on the right ... including the 'Donate' button ... just sayin'! So I've moved it to the end of the post!]
[Sorry! The viz was going to go in here, but it was conflicting with all the stuff on the right ... including the 'Donate' button ... just sayin'! So I've moved it to the end of the post!]
Notes on the data
Where there is any vagueness over the date I’ve gone for the earliest date. For example, the first press at Pilsen is thought to have been set up around 1476 or 1476, so I’ve simply taken the earliest date. Where there is no date listed, I’ve not included it. For example, the entry for Poland notes that ‘In the 15th and 16th centuries printing presses were also established in Poznań, Lwów, Brześć Litewski and Vilnius’, but does not contain more precise dates. Unfortunately, these presses have had to be omitted from the vizualisation. Similarly, as the only dating given for the press at Trondheim in Norway is ‘mid-16th century’ it has been (sadly) excluded. A Portuguese press in Mozambique was established 'As early as 16th century'. Given the lack of precision, this too has had to be omitted. Going the other way, I’ve had to make a couple of educated guesses when it comes to location. For example, there is a record of a press in Ireland in 1551 that was being operated by one Humphrey Powell. Rightly or wrongly, I’ve gone ahead and assumed that in such cases it’s much more likely to be in the capital city, rather than some rural backwater … but I could be wrong! In the case of Madagascar, there is no city listed and even though the country has only been governed from Antananarivo since 1992, I’ve decided to go with that as it has proven impossible to decide where the press was most likely to have been in 1825. For largely the same reasons, I’ve gone with Port Louis as the capital of Mauritius. Again, there is no city associated with the establishment of a press in Australia in 1795, but since the Wiki page detailing the events in the country in that year only really mentions New South Wales, I reckon that ascribing it to Sydney is a safe(ish) bet.
I’ve made some changes to locational data in that I’ve – again, rightly or wrongly – assigned the various towns and cities to their modern countries, rather than retaining their historic context. In the first instance, I’ve taken the first table on the Wiki page (Germany, Austria and German printers in Central Europe) and separated it out into the modern countries. Specifically, Breslau (modern Wrocław) is now assigned to Poland and Trento to Italy, despite both presses being established by Germans. By the same token, Strassburg (modern Strasbourg) is now listed amongst the French examples, rather than as a German one. Bohemia no longer exists as a state, so I’ve simply reassigned all the presses to the modern equivalent, the Czech Republic. In the same way, New Julfa and Tehran are both listed in their modern country of Iran, rather than the older Persia.
The Jesuit Missions of Paraguay founded a press in 1700. The Missions existed at two locations: La Santísima Trinidad de Paraná and Jesús de Tavarangue. As I’m unsure which site had the physical press (or if both sites were similarly fitted out), I’ve elected to map both for the sake of completeness. A date of 1494 is given for the establishment of a press in São Tomé and Príncipe by Valentim Fernandes, but the claim is considered to be dubious as the map in question appears to have been printed in Lisbon. For this reason, São Tomé and Príncipe has been omitted from the dataset. The Wiki article has a dedicated section on The Ottoman Empire. In keeping with the principles outlined above, I’ve broken this down into its modern constituent states. Thus, both Istanbul and Constantinople are in modern Turkey that, for the sake of argument, I’ve consigned to Europe. Similarly, the press founded around 1519-1523 at the Church of Saint George in Sopotnica, Sanjak of Herzegovina, in the Ottoman Empire is today a village in Novo Goražde, Republic of Srpska, in Bosnia and Herzegovina and is European. The cities of Bursa and Smyrna (modern İzmir) are also in Turkey, but are on the Asian side of the Bosphorus and are included in the Middle East region. The presses established at the St. Antonius Monastery, Qozhaya in 1584 and 1610, along with the one established in 1734 at the Monastery of St. John, Khenchara (both in Lebanon) are all assigned to the Middle East. The data for the presses at Qozhaya and Khenchara is duplicated in the Wiki article table for the Middle East, but not replicated in my data set, with the exception of picking up additional data for the Tooltip.
Although not mentioned in a separate table row, I’ve expanded on the comment for the 1883 press established in Seoul, Korea and included entries for presses in 1885, 1888, and 1891, along with a further press at the treaty port of Pusan (now Busan), Korea, in 1881.
With regards to the geocoding of the cities, Tableau requires Longitude and Latitude to be supplied as a decimal, rather than in the traditional format of Degrees, Minutes, and Seconds. To get this information, I’ve simply entered the city name into a geocoding batch converter (here). I’ve then performed simple error checking to ensure that the right dots turn up inside the right country boundaries. While I can be relatively sure that each one is in the right place, there is still a margin for error.
I’ve simply lifted the text from the various tables, giving (where known) the names of the printers and the associated comments. This can be accessed as a ‘tooltip’ by hovering over any particular point on the map.
Notes not on the data
As much fun as this little visualisation is, it's not an end in itself. It's really only a 'proof of concept'. As readers of this blog will be aware, I maintain the Irish Radiocarbon & Dendrochronological catalogue (IR&DD) [Facebook | Website]. At present, the resource contains over 7250 radiocarbon determinations and almost 290 dendor dates. While it has proven useful to many researchers since I made it publicly available, it could be more useful. But that's a project for another day ...
Part of the title is taken from the name of the 1998 compilation album by The Flaming Lips: A Collection of Songs Representing an Enthusiasm for Recording ... By Amateurs … but, of course, you knew that.
Go buy Wooden Wand's album Blood Oaths of the New Blues ... if you like it, then go to his website & buy all you can of his music! He's simply brilliant!
If you encounter any issues with the Viz, please try accessing it directly from my Tableau page: here.
* * *
If you encounter any issues with the Viz, please try accessing it directly from my Tableau page: here.


Comments
Post a Comment